Which areas have the most pothole problems?
Potholes are more than an inconvenience for drivers. These road defects can cause severe damage to vehicles, from suspension misalignment to punctures, leading to costly
tyre fitting.
With an estimated 1 million potholes on UK roads, drivers are becoming increasingly concerned about the rate at which roads are repaired and the costs of replacing
car tyres damaged by poor road conditions.
But which areas have the most potholes, and which local authorities are the most proactive regarding repairing roads?
To find out, we carried out a series of Freedom of Information requests, asking for the number of potholes recorded and repaired in each council area over the past five years.
As well as the amount spent on pothole repairs over the same period.
We also surveyed 2,000 people in the UK to find out how quickly their local roads are repaired and their experience with pothole-related vehicle damage.
Pothole Report: key findings

- Nearly six in 10 (57%) Belfast residents have had potholes damage their vehicles.
- Liverpool and Sheffield have the slowest road repair rates. Over one in six residents (17%) assert that it takes over six months for potholes to be patched in their cities.
- Over a quarter (26%) of drivers surveyed have had their vehicles damaged by potholes at least once.
- Over four in 10 (44%) 25-34-year-olds have had their vehicles damaged multiple times by potholes.
- Over a quarter (28%) of our respondents agreed that potholes in their area are rarely or never fixed.
Aberdeen had the UK’s highest proportion of potholes in 2024

- Aberdeen Potholes per 100 Kilometers of Road: 1,958
Aberdeen had the highest proportion of potholes in 2024 at 1,958 potholes per 100 road kilometres. The Scottish city had a brief drop in its total potholes in 2022 when it recorded more than 15,000. However, between 2020 and 2024, potholes rose by over a third (35%). - Newcastle upon Tyne Potholes per 100 Kilometers of Road: 1,809
Next is Newcastle. Last year the city recorded 18,378 potholes along its 1,016 road kilometres, slightly over a third (34%) more than in 2020. This is a proportion of 1,809 potholes per 100 road kilometres in 2024. - Cardiff Potholes per 100 Kilometers of Road: 1,574
Cardiff rounds out the top three.
Despite the number of potholes in the Welsh capital only rising by less than a tenth (5%) between 2020 and 2024, the city recorded more than 30,000 potholes in 2024. This is a proportion of 1,323 per 100 kilometres of road.
Bexley saw the highest increase in potholes since 2020

- Bexley 394% increase 2020-2024
Bexley has had the highest increase in recorded potholes over the past five years.
Between 2020 and 2024, the number of potholes in the London borough rose by 400% from 442 to 2,184. However, it did see a brief drop in 2022, when only 392 were recorded. - Slough
200% increase 2020-2024
Slough's total number of potholes tripled (200%) between 2020 and 2024, taking it to second place.
The town saw its highest year-on-year increase between 2021 and 2022 when recorded potholes rose by 182%. - Hammersmith and Fulham
199% increase 2020-2024
Just behind Slough is another London borough.
Although it has one of the lowest proportions overall in 2024 (140 per 100 kilometres of road), recorded potholes in Hammersmith and Fulham rose by slightly under triple (199%) between 2020 and 2024.
Newcastle repaired the most potholes in 2024

- Newcastle upon Tyne
Potholes Repaired per 100 Kilometers of Road: 3,001
Along with the highest proportion of potholes, Newcastle also tops the list for the most repairs in 2024, 3,001 per 100 kilometres.
This means more than nine in 10 (92%) recorded potholes were repaired in the same year. The city has also increased its pothole repair rate by over three quarters (76%) since 2020. - Cardiff
Potholes Repaired per 100 Kilometers of Road: 1,588
Cardiff takes second place with a proportion of 1,588 repaired potholes per 100 kilometres.
The city averaged around 17,000 repaired potholes annually from 2020 to 2024, although it saw a spike in 2023 when over 22,000 were repaired. Over the past five years, Cardiff’s pothole repair rate has risen by a tenth (10%). - Aberdeen
Potholes Repaired per 100 Kilometers of Road: 1,323
Aberdeen repaired 1,323 per 100 km of its road network in 2024, taking it to third place.
The Scottish city has increased its efforts to repair potholes over the last five years. Its 2024 total is over two and a half times (163%) more than that of 2020.
Croydon spent the most on pothole repairs in 2024
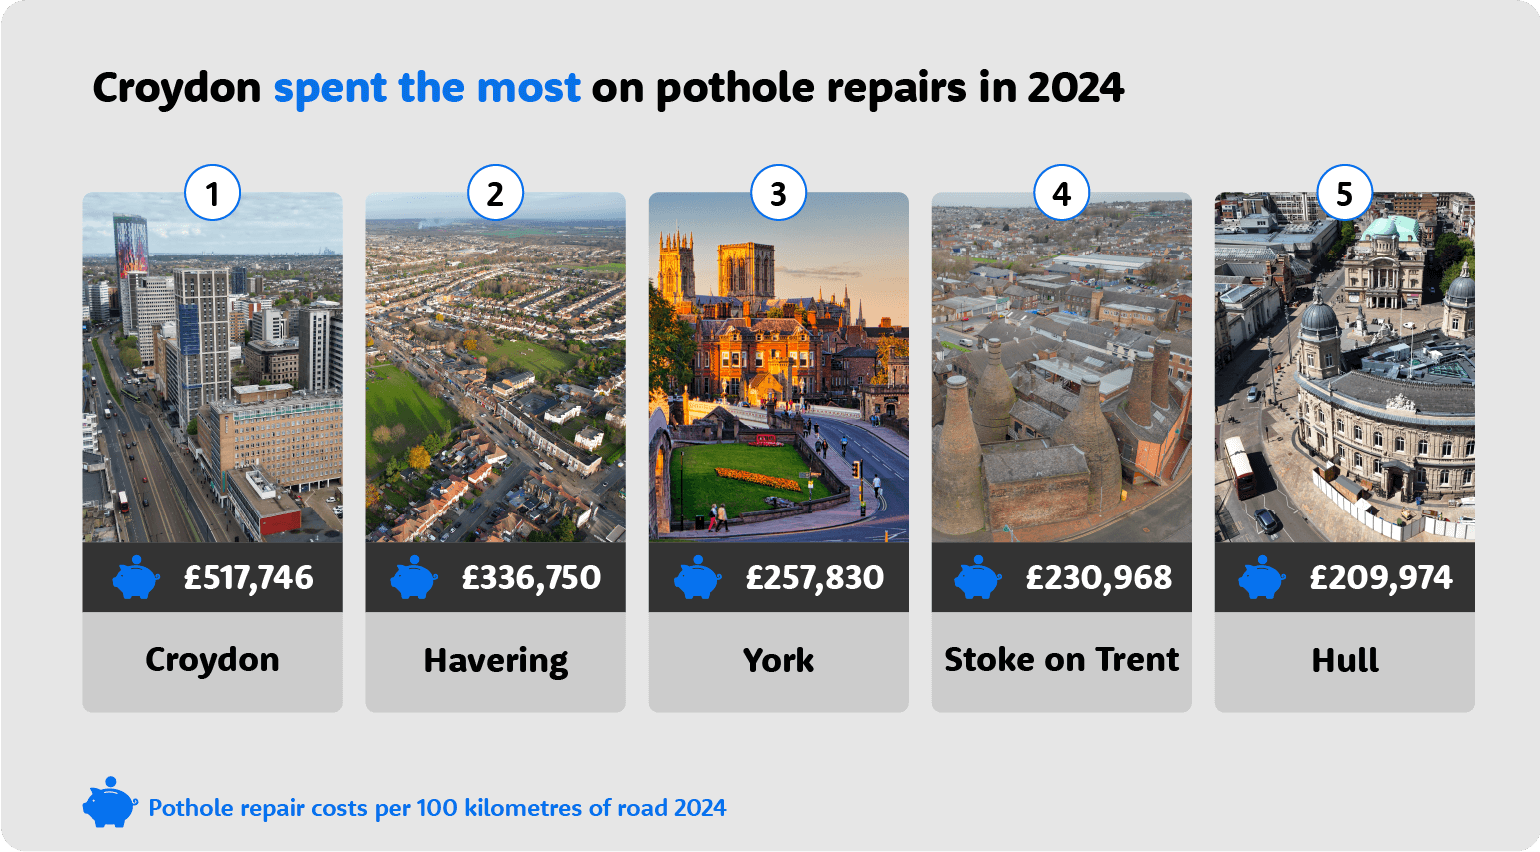
- Croydon
Pothole Repair Cost per 100 Kilometers of Road: £517,746
The London Borough of Croydon spent the highest proportion on pothole repairs per 100 kilometres of road, at a whopping £517,746, or £5,177 per kilometre.
This is nearly four times more (291%) than they spent in 2020. - Havering
Pothole Repair Cost per 100 Kilometers of Road: £336,750
In second place is another London borough, Havering. The borough spent more than £300,000 per 100 kilometres of its roads to fix its potholes.
This is around £800 per pothole repair. Havering also increased its spending on pothole repairs by more than double (130%) between 2020 and 2024. - York
Pothole Repair Cost per 100 Kilometers of Road: £257,830
York takes third place after spending £257,830 per 100 kilometres of road on pothole repairs last year.
The city’s annual pothole repair costs have increased steadily since 2020, when they totalled £1.3 million. In 2024, these costs increased to £2.1 million, a rise of more than half (52%).
Hertfordshire paid the most in pothole-related vehicle damage claims in 2023

- HertfordshireAverage Payout per Claim: £367
Regarding compensation claims paid out by councils, Hertfordshire paid the highest average in 2023, at £367 per claim.
This is slightly less than one and a half times the average payout (£261) and £93 less than the £460 drivers can expect to pay for vehicle damage caused by potholes. - Suffolk, SurreyAverage Payout per Claim: £350
Two local authorities take second place, with Suffolk and Surrey paying out an average of £350 per claim in 2023.
According to the data, the most successful claims were made in Surrey, with almost one in six (14%) successful claims compared to just over one in 10 (11%) in Suffolk. - GloucestershireAverage Payout per Claim: £327
In the South West, Gloucestershire had the third-highest average payouts for pothole-related damage claims in 2023 at £327.
While only one in 50 (2%) of claims were successful in 2022 and 2023, the number of claimstripled (223%) between these years.
Ceredigion had the highest proportion of pothole-related accidents in 2023

- Ceredigion8.2 Collisions per 100,000 people
While Ceredigion had only six pothole-related accidents overall in 2023, compared to its relatively low population, it tops the ranking.
During this time, the region had a rate of 8.2 pothole-related road accidents per 100,000 people. - Denbighshire7.2 Collisions per 100,000 people
Another Welsh local authority, Denbighshire, takes second place. In 2023, the area had 7.2 pothole-related collisions, three times the rate of accidents in Cambridgeshire at the bottom of the list (2.1 per 100,000 people). - North Yorkshire6.5 Collisions per 100,000 people
North Yorkshire takes third place. Potholes in the area caused 6.5 collisions per 100,000 people in 2023.
The local authority invested £500,000 last year in new road resurfacing equipment to speed up pothole repair and combat this problem.
What do drivers think about potholes?
Potholes can cause severe damage to vehicles and pose risks to drivers in the process.
To understand the impact of this problem, we surveyed the British public to find out how often drivers experience pothole-related damage.
We also asked how quickly pothole repairs are carried out.
Have you ever experienced damage to your vehicle due to potholes?
Our survey revealed that over one in four (26%) respondents have had their vehicles damaged by potholes at least once.
Just under a quarter (24%) have had multiple experiences with pothole-related damage.
Almost three in ten (28%) women said their vehicles have been damaged more than once by potholes, while just under a third (31%) of men admitted to having their cars damaged once.
Over a quarter of both genders (26% and 28% respectively) also know someone who has had their vehicle damaged.
Over four in 10 (44%) people aged between 25 and 34 have had their vehicles damaged multiple times by potholes.
This contrasts with those aged between 55 and 64; a third (33%) of this age group have never experienced pothole damage.
Our survey shows Northern Ireland is the region most affected by pothole damage.
Nearly six in 10 (57%) residents of Belfast have had potholes damage their vehicles.
This is just under double the three respondents in 10 (30%) in the South East who have experienced pothole damage more than once.
On average, how quickly do you feel potholes are typically resolved in your local area?
Overall, more than a quarter (28%) of our respondents agreed that potholes in their area are rarely or never fixed.
On the other hand, only one in 25 (4%) people see their pothole problems solved within a week.
Split by gender, more women than men (32%) notice potholes in their local area are rarely fixed.
Over one in six (16%) women agreed it takes three to four weeks to repair road damage.
Older generations tend to be more pessimistic about the rate of pothole repairs.
Over four in ten (41%) of 55 to 64-year-olds and nearly two-fifths (37%) of people over 65 agreed damage to roads in their local area is rarely or never fixed,
According to our survey, Liverpool and Sheffield residents have the slowest rate of road repair, with over one in six people (17%) asserting that it takes over six months for potholes to be patched in their cities.
Bristolians have the fastest rate. More than one in six (17%) are more likely to see their roads resurfaced within two weeks.
Report Finding Methodology
We wanted to investigate the number of potholes, the rate of repair, and the amount of money spent on road resurfacing by UK local authorities.
To do this, we sent the following Freedom of Information requests to all London councils and the local authorities of the 50 most populated towns and cities outside London:
- The number of potholes recorded each year (2020-2025), including potholes reported by the public and confirmed through council inspections (if these are reported differently)
- The number of individual potholes repaired each year (2020-2025), including temporary repairs (e.g., patching) and permanent repairs (e.g., resurfacing). Note this refers to the number of individual potholes that were repaired, not the total number of repairs.
- The total annual cost of pothole repairs, if available.
First, we revealed the UK local authorities with the most potholes in 2024.
We then normalised this against the road length in kilometres in each local authority to reveal the areas with the most potholes per 100 kilometres of road.
We also calculated the percentage of change in reported potholes between 2020 and 2024.
We repeated this process for the annual total of potholes repaired and each local authority's cost of pothole repairs.
Road lengths in 2024 were sourced from the
Department for Transport .
The average payout for pothole-related damage claims in 2023 was taken from the RAC.
The total number of reported road collisions caused by potholes in each local authority in England and Wales in 2023 was taken from the
Department for Transport .
This was normalised against 2023
ONS population figures to find the proportion of accidents per 100,000 people.
We also surveyed 2,000 people in the UK, asking the questions:
- On average, how quickly do you feel potholes are typically resolved in your local area?
- Have you ever experienced damage to your vehicle due to potholes?
The survey was carried out and is correct as of February 2025.

